How Well is Vaccination Protecting Us?
For Americans 50-79 years old, Covid deaths among the unvaccinated were about half as large as deaths from all causes in 2019. Among vaccinated from the same age group, Covid deaths were about 3% of 2019 deaths.
Twenty twenty-one has been the year of the Covid-19 vaccine, which was supposed to tame the scourge of Covid. How are we doing? There have been a lot of stories in the news about how Covid has become a “pandemic of the unvaccinated” because of the much higher number of Covid deaths among unvaccinated people and in states with lower vaccination rates. But how bad is it for the unvaccinated? How bad is it for the vaccinated? Do vaccines offer enough protection to return to something more like BC (Before Covid)?
It’s Better with Vaccination
Let’s look at death rates from the CDC’s data on deaths in 20 jurisdictions (see bottom for details). The jurisdictions cover a wide geographic area and include places with different politics and culture. Numbers are given for each of 26 weeks – half a year – from April 4 to October 2. The statistics are also broken out between different age groups, which is important because the fatality rate is vastly different for different ages. Here death rate means what fraction of a total population dies in a given amount of time.
Death rates are often reported as a weekly or even daily value – for example, the fraction of people who die in a given day. This is convenient for looking at fluctuations in deaths, but is not that helpful in trying to understand the impact of deaths. It’s not very meaningful to me to know that my chance of dying of Covid three weeks from Tuesday is about 1 in 2 million. I want to know what my chances are of dying from it over the next year: about 1 in 5000. Most US death statistics are given annually, including car accidents (32,000 – 1 in 10,000), suicide (50,000 – 1 in 7,000), and cancer (600,000 – 1 in 600).

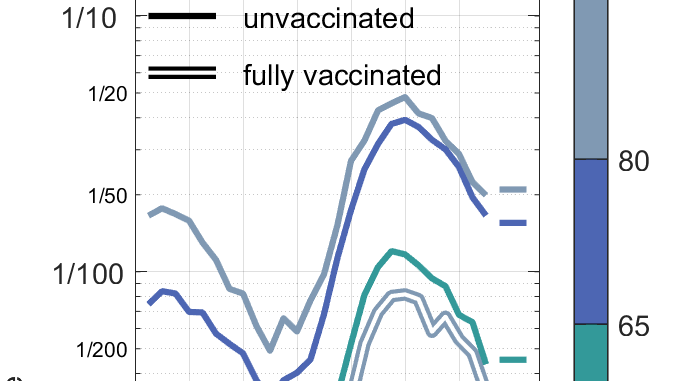
Figure 1 shows how high unvaccinated death rates can go. The horizontal axis represents age, and each bar spans the age range of the group it represents. As is often pointed out, older people have a much higher risk of Covid death. Both seniors (65-79) and the elderly (80+) had death rates of around 1/50 if they are unvaccinated. That means about 2% of unvaccinated people 65 and over would die in a given year at the rates seen during this period. Taking into account their share of the population and the fact that the period is only half a year, this group alone accounts for about 130,000 deaths. The middle aged (30-49) had a chance of dying of Covid at an annual rate of 1 in 1000, far worse than rates for traffic accidents and suicide; for mature adults (50-64), the chance of dying of Covid (1 in 200) was greater than the chance of dying from cancer. Even young adults (18-29), considered by some to be at low risk, died of Covid at a higher rate than by suicide and car accidents.
Covid kills vaccinated people at a much lower rate. For the elderly, the rate was about 6x lower than the unvaccinated elderly. All the other adult group rates were over 20x lower, and young adults had a 70x lower death rate. Even with vaccination, the elderly have a substantial risk of death, more than 1 in 500. Seniors have less than 1 in 1000, and mature have about 1 in 5000.
Another way of thinking about Covid risk is that each decade of age multiplies the chance of getting Covid by about 2.4. Vaccination takes decades off your risk profile; a vaccinated person in the 50-65 range has almost as low a risk as an unvaccinated 18-30-year-old.
Is Better Good Enough?
It’s clear that death rates have been much better with the vaccine, but is that good enough? If you have gotten your booster shot, can you consider the Covid emergency over? How low is low enough?
One way to think about this is to compare the death rate from Covid with the chance of dying of all causes. That probability, pre-Covid values tabulated by the Social Security Administration, is included in Figure 1. Astoundingly, unvaccinated people in the middle aged, mature, and senior groups had death rates from Covid that were only around 2 times smaller than the previous all-cause rate.
All the vaccinated age groups had rates that were at least 30x smaller, with young adult Covid death rates nearly 500 times smaller. An increase of 10% or more in the death rate, which is what we saw in 2020 and which would bring hundreds of thousands of fatalities, is hard to tolerate. An increase of 2% or less is not as clear. Obviously if there are easy ways to reduce those deaths, we should do them, but reducing physical contact and wearing masks in all public indoor settings also comes with its own emotional and economic costs. Do we continue them if higher vaccination rates get the nation down to 2% of pre-Covid deaths? 1%?
Is it Just the Vaccine?
I’ve been discussing the death rates as if they only depend on age and vaccination status. However, 2021 had large swings in death rates, with relatively low values in early April and even lower rates in May, followed by a wave which peaked in August. As Figure 2 shows, this pattern held for vaccinated and unvaccinated people in all age groups.

What made the wave subside? It is plausible that it was changes in behavior. Upon getting vaccinated, many people started to do things they had avoided for a year, such as go to restaurants, travel, come into the office, visit friends and family, and stop wearing masks. When the case numbers started reaching alarming heights in June and July, many people went back to some of their social distancing measures and masking. Institutions and localities that had relaxed mask requirements reinstated them.
This raises the question of whether the average rates shown in Figure 1 are even sustainable without taking other measures. If the death rates for vaccinated people this year are on the cusp of what might be acceptable, having rates climb because people stop social distancing will not be acceptable.
The issue of people’s disease avoidance behavior raises another question: is the difference in death rates between vaccinated and unvaccinated people all due to the vaccine? Perhaps the people who are most likely to get vaccinated are most likely to follow social distancing procedures, which would also lower their risk. I already showed that states with higher vaccination rates had lower rates of infection and death in summer 2021, but that those same states also had lower rates in summer 2020, long before the vaccine was available. Other factors may also enter. People’s health may be correlated with the likelihood of being vaccinated, though the trend could go either way. People in worse health may be more likely to vaccinate because they are more worried about catching Covid, but people with lower socio-economic status might be more likely to be in poor health and be less likely to vaccinate.

As Figure 3 (top) shows, about 40% of the population (12 years old and older) is 50 or older. Despite slightly smaller numbers of people, relatively high death rates mean that these older age brackets contribute the majority of deaths to both the vaccinated and unvaccinated categories. The good news is that 65+ had the highest vaccination rates (Figure 3, bottom), over 70% for most of the time period. The 50-64 group underwent the most vaccination in the 1st 8 weeks, but despite lower rates of getting vaccination after that, managed to almost reach 80% vaccination by the end of the period. From the point of view of preventing deaths, the high vaccination rate of older groups is very fortunate, but from the point of view of preventing spread, the low rates of the younger 60% of the population may be a serious problem.
Since infection rates are higher for the unvaccinated, they may act as a vector to spread the disease to the vaccinated, who are not completely immune to it. So, while relaxing social distancing brings the risk of more spread, increasing vaccination rates may decrease spread and so reduce death rates for both vaccinated and unvaccinated.
The new omicron variant of the disease and progress in medical treatment of patients with Covid bring additional negative and positive trends to the prospects for a return to normalcy. Based on the experience of the United States this summer, a vaccinated population may be close to the point where onerous measures to prevent the disease can be relaxed, but there is still great risk in doing so.
Data Source
Data comes from CDC’s data on deaths in 20 jurisdictions (CDC, COVID-19 Response. Rates of COVID-19 Cases or Deaths by Age Group and Vaccination Status Public Use Data (version date: October 14, 2021). Twenty-four jurisdictions (states plus 2 cities) reported infection and vaccination data. These are listed in table below, arranged in roughly geographical placement. Of these, 20 (not specified in source) also reported death statistics.
| WI | MI | MA | |
| ID | IN | CT | RI |
| UT | NE | NY | NYC |
| CO | KS | Philad | MD |
| NM | AR | TN | NC |
| FL |