State Covid Rates Decrease with Vaccination – Or Do They?
The CDC reports that, based on a survey of health data from regions comprising about 30% of the total US population, in August vaccinated people had six time’s smaller chance of testing positive for Covid and 11 times smaller chance of dying from it (https://covid.cdc.gov/covid-data-tracker/#rates-by-vaccine-status). Is this difference reflected in the variation in Covid among states with different levels of vaccination? I looked at this for individual weeks in June and July, but here I will look at the entire summer.
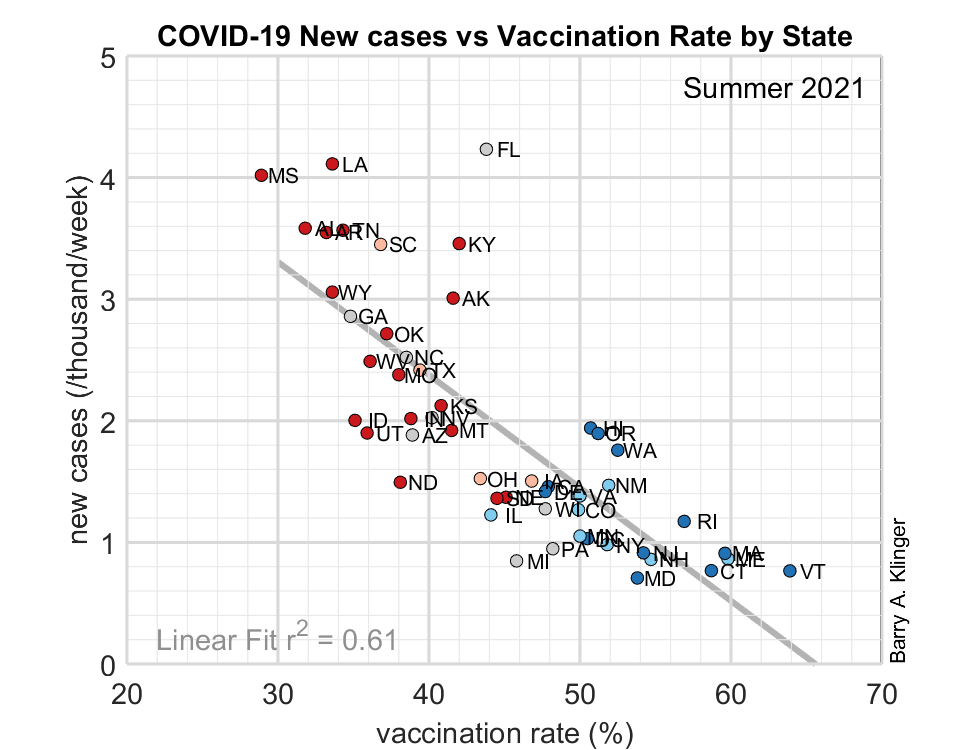
Here I make the comparison for the prevalence of covid infection (as measured by fraction of the population who are diagnosed with a new case of covid each week) and by death rate (weekly fraction of the population who dies from covid). In both cases, these are plotted against the fraction of the population who was vaccinated. Here I use the vaccination rate at the beginning of summer and the case rate and death rate for the entire summer (13 complete weeks).
As the plots show, both measures have Covid declining as vaccination rates increase. The case rate shows a particularly strong dependence on vaccination. In deaths, Florida is an outlier; if we remove just this one point, r2 increases from .41 to .56.

These figures seem to show the result that many people would expect: since the vaccine is supposed to protect against Covid, states with higher vaccination rates had fewer infections and fewer deaths. The markers for individual states are color-coded for political leaning based on the 2020 presidential vote. Markers are colored blue if Biden won the state, red if Trump won, and grey if the margin was less than 5%; darker shades are used for margins of > 15%. The colors show that high-vaccination states are almost exclusively Democratic leaning by this measure and low-vaccination states are exclusively Republican.
The strong correlation between vaccination and infection is especially interesting because some studies have shown that the vaccine does a much better job of preventing severe illness and death than preventing infection (Cohn et al., 2021). If the vaccine reduces the number of infections, it can be an important tool in squelching outbreaks. If the vaccine provides protection to the community at large, that may justify pressuring people to take the vaccine even if they don’t want to. If not, a more laissez-faire approach may be more appropriate. The vaccination/infection correlation suggests that vaccination does indeed reduce spread.
But let’s look at similar plots. The horizontal axis is still the June 2021 vaccination rates, but now the Covid case and death rates are for summer 2020. Case rates are robustly correlated with vaccination. Death rates also show increase for lower vaccination rates, but with r2 of only .32 (deaths also had a smaller r2 than infection rates in 2021 as well). While it is plausible that vaccination reduces subsequent infection and death, it is impossible for vaccination to affect prior illness!

It is possible that both vaccination and infection rate are correlated with another variable, such as the population’s willingness to take any measures that might protect against Covid. Thus, states with higher vaccination rates in 2021 may, in 2020, have also practiced more social distancing, mask wearing, and other behaviors that protected against Covid. This does not mean that the vaccine was useless, because social distancing measures, such as closing stores and restaurants, were stricter in 2020. But it does suggest that in 2021, the decrease in Covid with increased vaccination could have been due to other factors besides the vaccine.
If population behavior could protect against Covid before the vaccine, we might expect a similar correlation during winter 2020/2021, when the US was struck by the most severe wave of Covid so far. However, this shows a quite different result: virtually no correlation between vaccination and either infection rate or death rate. If the highly vaccinated states of Summer 2021 were taking strong measures against Covid in Summer 2020, perhaps they became more lax in the winter, when the virus could have been spread in Christmas/New Year holidays.

To summarize, more highly vaccinated states did better than less vaccinated states against Covid this summer, but these highly vaccinated states also did better the previous summer when people had not yet been vaccinated. However, they didn’t do any better in the winter. While the data are consistent with vaccination being an effective tool against Covid, it also points to the complex nature of the pandemic in which other factors may be equally important.
Some Details
Daily Covid infection and death rates from the CDC: https://data.cdc.gov/Case-Surveillance/United-States-COVID-19-Cases-and-Deaths-by-State-o/9mfq-cb36. Data used was total new cases and total new deaths. Rates were calculated by dividing state Covid numbers by 2020 state population.
Vaccination data is from the CDC: https://data.cdc.gov/Vaccinations/COVID-19-Vaccinations-in-the-United-States-Jurisdi/unsk-b7fc/data.
State populations from US Census, dataset DECENNIALPL2020.
Daily data was binned into heptal seasons: 13 week periods starting on a Monday. Summer 2021 began 21 June.