Europe: Strategic Snapshot
Comparing Economies
With talk of open warfare between Russia and Ukraine lately, now is a good time to look at a strategic snapshot of Europe.
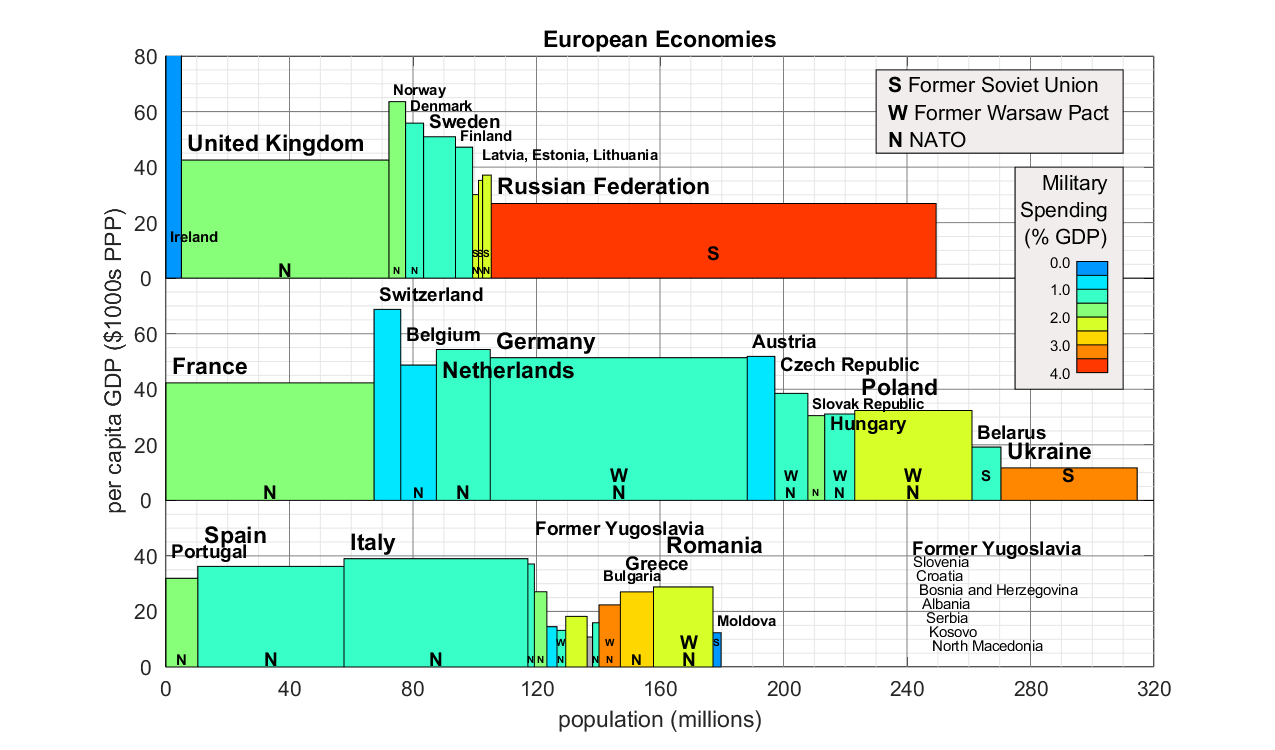
The figure shows all the countries of Europe (excluding those with population < 1 million). Width of each rectangle represents population, height represents per capita GDP, and so area represents total GDP. The “countries” are arranged approximately geographically on the chart, northern countries at top, eastern countries on the right.
Despite its former superpower status, Russia’s population of 140 million or so people is only a small fraction of Europe, which has a total population of over 800 million. Because of its below-average per capita GDP, Russia’s economy is an even smaller fraction.
Russia still dwarfs Ukraine though. Ukraine has only only about 40 million people and half the per capita GDP of Russia.
Earlier I created a similar figure for the world as a whole (2010 data).
Military Spending
Russia devotes a bigger fraction of its economy to the military than other European countries: almost 4%, compared to almost 2% that the UK, and France each spends, and 1-1.5% that most other countries spend. Besides Russia, other countries with relatively big military budgets include Greece (almost 3%), Ukraine (over 3%) and several other eastern European countries such as Poland, Romania, and the Baltic republics (Estonia, Latvia, and Lithuania). It is likely that high spending in the east is related to fear of Russia itself. For reference, the US spends about 3.4% of GDP on the military, though it was spending almost 5% about a decade ago and 9% in the early 1960s.
Most of Europe is militarily allied through NATO (see chart). Even excluding overseas allies Canada and United States, European NATO members have an economy about 4x as large as Russia’s and hence greater collective military spending as well despite the small percentages of spending.
I don’t know much about military forces currently in Europe, but I believe it is plausible that the mediocre Russian economy hides a relatively powerful military. Even when using PPP dollars, I can believe that relatively poorly paid soldiers and relatively inexpensive weaponry in Russia could pack a much bigger punch than its dollar value suggests. Add to that an advanced aerospace sector, institutional memory of the Soviet Union’s superpower status, and the complexity of a European alliance including of dozens of countries with very different levels of engagement in Eastern Europe, and it could be dangerous to overestimate Europe’s advantage.
What Happened to Russia?
The last 30 years have been one in which conflict with Russia has seemed more or less obsolete since the fall of the Soviet Union, and yet conflict in Ukraine and elsewhere have renewed Cold War tensions. Though Russia has improved its economy and reconstituted its military after a steep post-Soviet decline, it still is at a big strategic disadvantage. Russia itself is considerably smaller than the Soviet Union was, though it seems to be working to re-absorb former Soviet territory, particularly at least some of Ukraine. It has also seen former Warsaw Pact allies such as East Germany and Poland switch sides. NATO now includes at least 80 million people living in countries previously allied with (or captured by) the USSR.
What Happened to Ukraine?
Eastern European countries like Poland, Romania, and even more so the Czech Republic have somewhat higher per capita GDP than Russia. But Ukraine is considerably poorer. This may be due to corruption and lack of economic reform in Ukraine, which I have seen described as worse than Russia’s economic problems. Of course, a Russian-instigated rebellion in the East and other Russian aggression does not help.
Why is Ireland So Rich?
The Swiss, famous for an “industrious” culture and a history of morally questionable banking, have the second highest per capita GDP in Europe among countries with at least a million people (tiny Liechtenstein is richer). Next come the Scandinavian countries along with some others such as Germany, Austria, Belgium and the Netherlands, around $50-60k/person. Significantly below that are France, UK, and Italy, all around $40k/person. Iberia, Eastern Europe, and the Balkans and Greece follow, with former Soviet nations such as Ukraine and Moldova bringing up the rear.
And then there is Ireland, whose per capita income is so high its off the chart. This is strange because until recently Ireland has been relatively poor. At least one reason is that Ireland has become something of a tax haven for corporations which declare their income in Ireland even if the economic activity is happening elsewhere. It looks like Ireland has also undergone significant real economic growth as well in the last decade.
Why is Europe so Poor?
The United States has per capita GDP of about $64k/person, much higher than countries such as Germany or Britain that are considered economic peers. Why are the “rich” countries of Europe so poor compared to the US? Harvard economics professor Martin Feldstein answers this question with a list of corporate-friendly US policies such as weak unions and “a more developed system of equity finance”, but he also mentions one factor that by itself could explain much of the difference. Americans work more, 1800 hr/year on average compared to 1500 in France and 1400 in Germany. I don’t know exactly what goes into collective work hours, but perhaps Europeans have simply chosen to have less money and more free time.
Back to Russia Vs The West
To summarize, Russia has the population, economy, and military spending to crush Ukraine, but is a small player compared to the collective economic and military power of NATO. If Russia openly attacks Ukraine or continues in other aggressive behavior, it seems that European NATO members should have the potential to apply meaningful economic pressure in response and to defend itself against military threats against most member states. I’m not arguing for US withdrawal from Europe, but leadership in European conflicts could fall to Europe.
Details
GDP is calculated using “Purchasing Power Parity” adjusted for differences in prices so that a PPP dollar in each country is supposed to buy about the same amount of goods and services as a dollar in the US. Population and GDP data is for 2020 from the World Bank. Military spending data is most recent year available (generally 2019) from Our World in Data.
Countries are plotted left to right based on the longitude of their capital city. I moved a few for readability however: Switzerland, Finland, and Austria. For instance, Austria is mostly west of the Czech Republic, but Vienna turns out to be east of Prague.