Yep, Republican States Get Covid More
Since I, my family, my friends, and a majority of people here in the DC region are vaccinated and mask mandates have come down, I’ve been feeling pretty post-pandemic. But the latest numbers are a splash of (tainted) cold water.
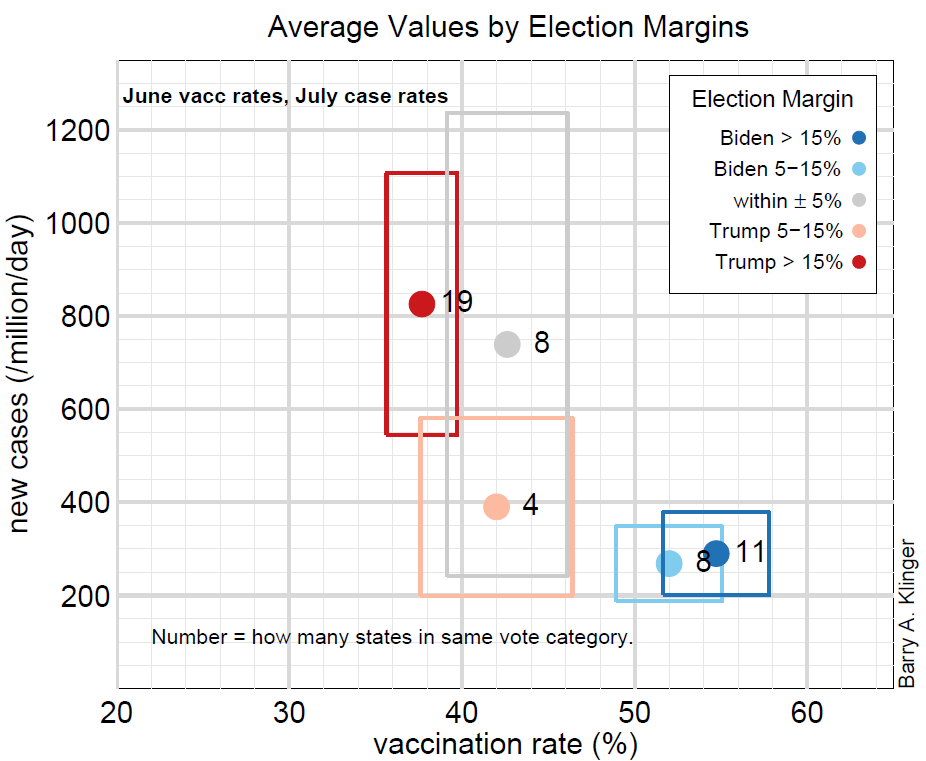
Looking at individual states, we can see a clear trend: more Republican –> less vaccinated –> more Covid cases.

This is a much clearer trend than when I made the same graph in June. Averaging states sorted by their vote in the 2020 presidential election also gives a clearer trend than before.

Coming down with Covid is bad enough, but we are most concerned with severe cases, so I plotted the death rate also. This does not have as strong a trend as cases. In fact, it looks more like the case numbers from last month. That’s not surprising, since death statistics tend to lag case statistics by about a month. Therefore, the trends seen in the recent case statistics should become obvious in death statistics in another month. An analysis of vaccination rates by age show that many middle aged people – less at-risk than the elderly, but still vulnerable to the disease – are not vaccinated.

Unfortunately case rates are going up all over the country. Note that today’s post shows deaths and cases per week, and the previous post was per day. Even the most vaccinated states have seen infection rates increase by about 40%. It’s just that this is dwarfed by the least vaccinated states, where infection rates have almost tripled. Low-vaccine states are doing far worse, but no state can afford to be complacent.
By the way, 10 deaths/million/week translates into 170,000/year for the whole country, so its fair to say that pandemic deaths are still raging, particularly in the red states.
Some Details
Vaccination rates use same Washington Post data as in the previous post. New infection rates and death rates are sum of last 7 days and come from the CDC website.