Happy Equinox: Solar Energy Edition
3/21/2021 update: See end of article.
To celebrate Spring Equinox 2021, I present to you my experience installing solar panels.
The Short Version
We had a solar panel system installed for about $11,000 (after federal and state incentives). Installation and operation has had no problems at all. The installer estimated generation of over 7000 kWh a year, and that’s about what we got in 2020. For us that’s an annual savings of over $1000, plus extra subsidies which pay us a few hundred dollars a year. Based on these numbers, our solar panels pay for themselves in about a decade and may save ten thousand dollars or more over their lifespan. Solar panels are an investment even an anti-environmentalist can love.
The Long Version: Getting Started
We had wanted to get panels for a while, but also needed a new roof, and ran into a problem: roofers wouldn’t guarantee it against leaks once panels were installed. We solved the problem by hiring a solar panel installer that also did roofs. In case of damage, no one could point a finger at a different company. As it happened, the company was also awarded a contract through the Montgomery County Solar Co-Op, which bargains collectively to get a lower price on solar panel installation. Between the year-to-year drop in prices for solar panels, and the good price negotiated by the co-op, our quote was thousands of dollars lower than a quote we had gotten a year earlier.

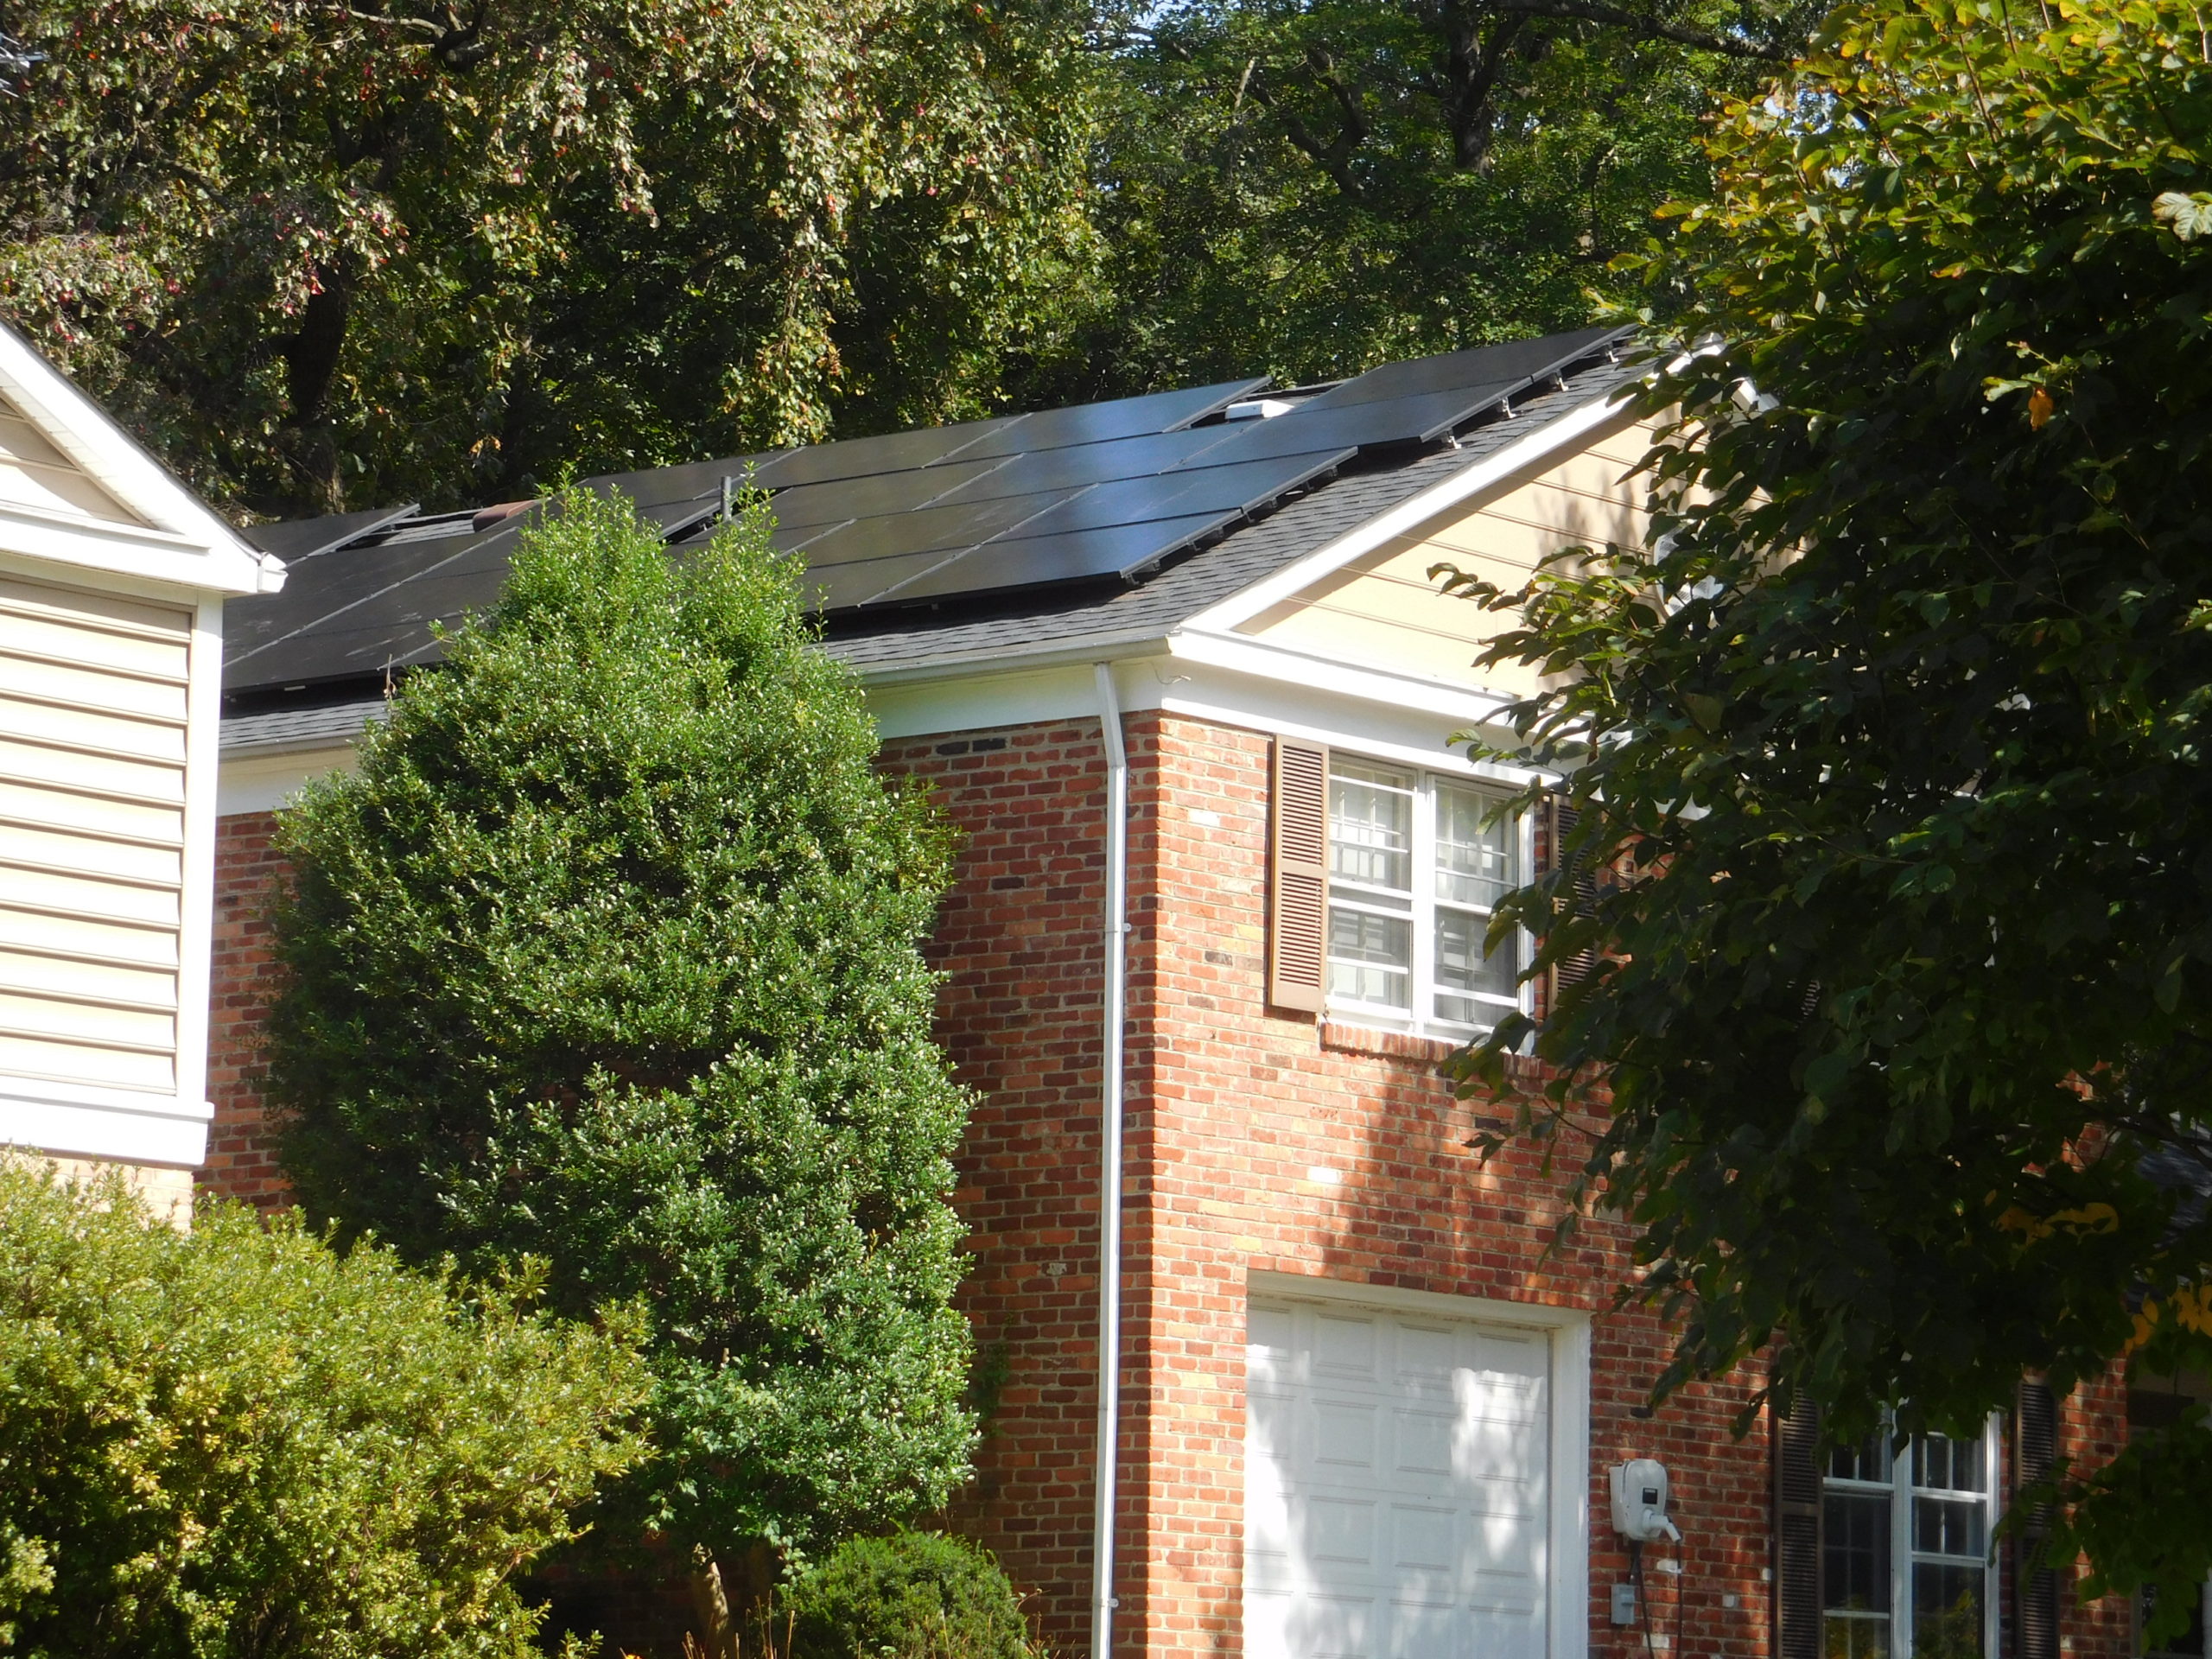
Solar Works Even Without Southward-Facing Panels
The greatest exposure to sunshine is for panels facing southward. The front of our house (#12035 in the picture from Google Maps) faces south, but there is not a lot of roof with a southward slope. Even worse, there is a large maple tree in front of our house (strangely hard to see in the satellite picture). The westward-facing roof is unobstructed though, so it gets good afternoon sun all year.
Summer electric demand is near peak in the late afternoon, so our contribution to the electrical grid is most useful then. Generally the electric company tries to keep the cheapest generating sources running all the time, and adds more expensive ones when there is higher demand for electricity. Thus the fact that westward-facing panels reduce the need for the most expensive energy makes them particularly valuable. Of course, if you have southward-facing panels, they will get more electricity per panel because they will be getting sunshine all day.
The solar company analyzed our potential for solar power, and this is what it came up with:

The estimated annual energy would be 7560 kWh. A kilowatt hour (kWh) is the amount of energy expended when 1000 W of power is used for an hour. We use over 13,000 kWh a year, which is a more energy than a typical household our size (me, my wife, and one of our kids when he’s home from college). Part of that is because we use an electric heat pump for much of our heat (more efficient than a gas furnace) and we charge my Chevy Volt at home. The car alone takes 14 kWh per charge (enough to go about 38 mi), which comes to over 2000 kWh a year if I charge it 3 times a week.
The estimated solar electricity generation is around 60% of our electric usage.
Solar Panels Will Save Me Money

In summer 2019 we got an installation estimate: about $16,000 minus a federal tax credit almost $5000 and a state grant of $1000. I think the salesman said that the estimates tended to come out a little high, so let’s assume that the actual electrical generation is about 7000 kWh. Our electricity cost is about $.153/kWh, so this would save (7000 kWh)x($.153/kWh) = $1070 a year. In slightly over ten years, the savings come to more than the original costs.
The panels should last around 25 years, so we are spending about $11,000 to get $27,000 worth of electricity. The panels degrade a bit over time, but I think we can still assume at least $20,000 of electricity, perhaps closer to $25,000. That’s at current prices. Electricity prices may be higher or lower in the future. I’m guessing higher.
The federal tax credit was supposed to go away in 2022, but it has been extended by Congress. As far as I can tell, the grant from the state of Maryland still exists. Other states also have incentives for installing solar.
Your electricity may cost a little less than ours. We use a third party supplier to sell us energy from wind turbines. Its easy to do. With our utility, we just have to sign up for the other supplier and part of the money we pay in our regular utility bill goes to that supplier. In the case of wind, our utility is supposed to buy as much energy from wind sources as all the wind customers buy. That’s the theory – anyway. It’s a bit abstract, which is another reason to go solar. You can go outside and see it.
Theory versus Reality
In Fall 2019, our roof was replaced, and the panels were installed. All the construction went off without a hitch.

The short tree that you see next to the panels was trimmed back to below the panel height.
After over a year of getting power from the panels, I compared my electric usage (electricity that the utility charged me for) in 2020 versus a baseline from 2017 and 2018.

Its clear that we pulled a lot less electricity from the grid once we had the panels up. The baseline electricity usage is high in the winter (heating) and summer (cooling), and lower in spring and fall. I can monitor the actual energy generated by the panels, which I show in the next figure. As a check, I also calculated the difference between 2020 energy usage and the baseline (average of 2017 and 2018).

Solar generation is about 7200 kWh for the year, a little less than the estimate (as predicted). As expected, it reaches a high in summer and a low in winter. I would have expected the peak to be in June (longest day is the summer solstice, generally around 21 June), but its actually July. If our usage was the same every year, than the difference between the baseline and 2020 should equal the solar generation. Differences from year to year are due to different weather (for instance cooler summer days need less air conditioning) and to different usage (for example, if we went away for a week in one month). There’s an additional, more subtle and annoying reason for the discrepancy, which may explain the big difference between the bars in July. If this detail does not interest, you can skip the following paragraph.
Our electric company uses net metering, meaning they are supposed to charge us for the electricity we use minus the electricity we generate. However, it does this separately for different days and times, differentiating between on peak, off peak, and intermediate peak. If the on-peak generation is greater than the on-peak usage in a given month, the extra generation is stored for the following month. If that month uses more than it generates, some of the extra generation credit is “spent” on electricity that month. Every April, an accounting is done in which money for any remaining energy credits is paid to the customer (but at a lower rate than what we pay the utility for energy). Because my graphs show the calendar year, there were some energy credits (about 600 kWh) at the end of December which eventually got used up in the first few months of 2021, but because they are not included in 2020, they reduce the total shown for 2020.
Including the factors described in the last paragraphs, the 2020 electricity generation reported by the panels, and as estimated by the difference between 2020 and recent years without panels, are in approximate agreement: 7200 kWh, about what I expected.
Extra Money for Free
Every once in a while I get a check from SRECs: Solar Renewable Energy Certificates. These are a way for other institutions to help subsidize my solar panels. Maryland law mandates a reduction in greenhouse gas emisions, which puts pressure on utilities to produce green energy. Rather than putting up solar panels themselves, the utilities give money to other energy producers, including me. For every 1000 kWh of solar-powered electricity your panels make, you get an SREC, which utilities and others buy from you.
The price of the SRECs goes up and down quite a bit, but in 2020 I think we got around $500 from SRECs. At the moment, every 1000 kWh you generate earns you about $80 in Maryland, according to SRECTrade. Other states may be even more, for instance around $230 if you are lucky enough to live in the Garden State of New Jersey. So in addition to saving money on electricity, the panels provide a small income stream. But in Oklahoma, you have to pay gas companies $75 for each 1000 kWh you generate. Alright, I just made that up. Oklahoma “does not currently have a viable SREC market,” nor do sunny states such as Florida or Texas
Including SRECs, the payback time for the system could be something like only 5 years rather than 10 – if the SREC price stays close to its current value.
Now It’s Your Turn
If you have a home that is suitable for panels, having solar panels installed is one of the most valuable upgrades you can do. If you don’t have the money lying around to invest in a system, there are other financing options.
You probably want to install a system to capture solar energy because you don’t want to contribute to making dangerous changes to climate. However, even if you don’t care about climate, solar has gotten so inexpensive that buying a system will save you money in the not-so-long run. If you continue to obtain electricity by burning coal and natural gas, you are basically spending extra money for the privilege of damaging the environment.
Note on 21 March 2021 Updates
Based on feedback from the Kinter family, I made a few corrections to the original post, fixing a typo on the energy represented by an SREC, giving a more realistic (and higher) estimate of my income from SRECs. and updating the info on the federal tax credit for solar.

Impressive and convincing! which company did you use? would you recommend them?
https://www.solarenergyworld.com/
I definitely recommend them. No problems with installation, no problems after installation, and the electrons seem to be flowing more or less as advertised!