Can You Draw the United States?
Can you draw a map of the United States – showing all the states – without looking at a map for guidance?
I feel like I should be able to. I remember copying a map of the world by hand (at least part of it) when I was about six, and in the decades since I must have looked at maps of the US at least five thousand times. But a few years ago I realized I couldn’t draw it from memory. I started with a few states that I thought I did pretty well and quickly found that I had left a huge gap between two neighboring ones or ran out of room to put one inbetween two others I had already drawn.
This post is for any of you who would like to be able to draw – or at least visualize – the Lower 48 states. What good will this knowledge do you? Other than satisfying your desire to picture all the states, probably none.
Mapping Like a Physicist
I don’t think it’s worth the trouble to draw every wiggle and bend of every border or to even get the general shape more than approximately correct. Therefore I’m going to think of the map the way a physicist might. I’m going to start out with the simplest approximation I can find that captures the main features. My hypothesis is that it will be easier to remember the approximation than a more realistic image.
Here is about the simplist outline of the Contiguous US (CONUS) that anyone would draw.


The idea going forward will be to divide the US into a few regions as simply as possible. There should be few enough regions that it is easy to create them, but regions should be small enough that it is easy to later subdivide them into individual states.
First thing to notice is that there is one [mostly] east-west line that forms a boundary between many states:

This line divides the country into roughly a southern third and a northern two thirds. Next step is to then divide the country east-west. There are several ways to do this, but I chose the following:

I wanted to get the West Coast, Mountain West, and East Coasts to be separate regions. The key tricky boundary is the Mississippi and Ohio River systems. Mississippi-Ohio (plus the boundary between PA and OH) separates the East Coast, and Mississippi borders the Plains. I was tempted to use the north-south line that starts at the TX-LA border, but I decided that the Mississippi River made more sense as a regional boundary. The bifurcation of the river into the Mississippi and Ohio leaves a small number of states in their own zone. We can call these the Great Lakes states (yes, a few others touch the Lakes as well), once known as the Old Northwest, and it does actually make sense as a distinct region.
This area is also why it’s not a good idea to approximate CONUS as a big rectangle with Florida hanging off the southeast. If we ignore the bite that Canada takes between the Northeast and the Lakes states, it gets very hard to make sense of the boundaries between New York and Michigan.
Finally, I thought it was worth putting in a few more (mostly) east-west boundaries: one in the West, one bounding Florida, and the Mason-Dixon Line:

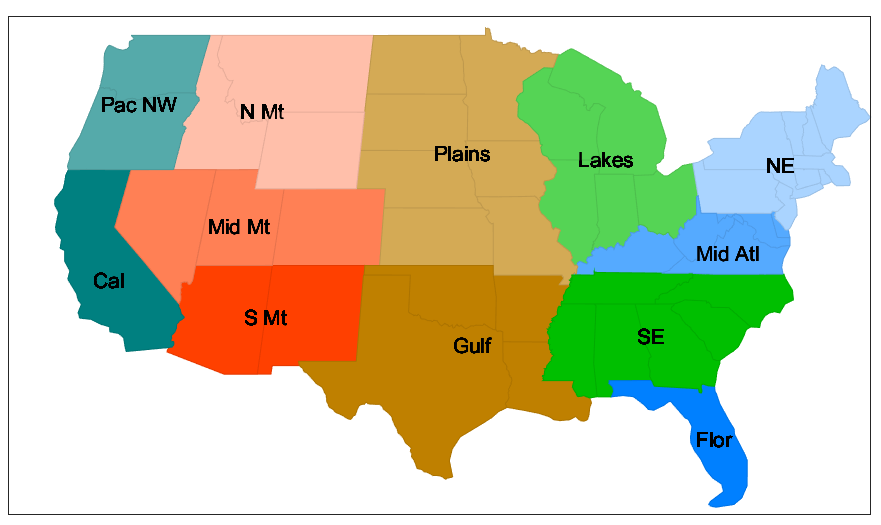
This arrangement meets my criteria of being fairly simple to create (just need to draw 8 boundaries inside the US outline) and – maybe – fairly easy to subdivide. The simplified boundaries I drew here correspond to the regional boundaries on this more accurate state map:

Some may object to putting VA in the “Mid Atl” or OK and AR in the “Gulf” region. To those I say: draw your own map!
Can I Draw USA Now?
Now that I’m satisfied with the geometrically simple and geographically reasonable approximation I have made to CONUS, can I actually draw it?
I gave myself a test. I drew the outer boundary and regional divisions from memory:

I forged ahead and drew the states from memory:

Full disclosure: this isn’t what I originally drew. I made a few changes once I looked at a real map:
- Added SC, which I had forgotten. Sorry SC, no offense intended!
- Flipped OK east-west; my first version had the pan-handle part facing east. Sorry OK!
- I moved the boundary of CO-UT to line up with the AZ-NM boundary; otherwise, no Four Corners.
- I flipped the TN-NC border and made small adjustments to WV-KT.
There are a few problems. NV is a victim of problems with border with CA, and so is pretty unrealistic. MI and IL are a little strange. Because I simplified the coastal border of the NE, the states are a little out of place: CT and MA should border NY, not NJ. I was just being lazy with the coast. As an oceanographer and a resident of NY and MA for 30 years, I could do better.
Still, I think the results are about what I was hoping for. Once SC was recovered, the sketch had the right number of states, and almost all of them are in about the right place and in about the right (highly idealized) shape.
Your Turn
How about you – can you draw a US map? Send me your map, hand-drawn and created from memory, of regions and/or states of the Contiguous US and I’ll add it to the post. If you have a different way to remember the shapes, let me know and I can include that as well.
I’m used to looking at physical maps which have circles, ovals, and “blobs”, but political maps can be rather complex. It hurts my brain looking at a county map of VA. I’m in no hurry to try to draw all 86 counties and 38 independent cities. But since lately I’ve been looking at climate and weather data over land, I wonder if amalgamating political units into a smaller number of groups is generally a helpful way to make sense of complicated spatial data.
The states of CONUS break down rather naturally into north and south groups and into zonal segments roughly corresponding to Pacific, Mountain, Central, and Eastern time zones. There’s a little extra complexity because the northern “half” naturally breaks down into two latitude bands, and the large area east of the Mississippi also has a natural additional subdivision of Great Lakes states north of the Ohio River.
Despite what I said at the beginning of the post, this exercise may be useful for something: teaching children the geography of the US in terms of these divisions. The divisions are probably implicit in many social studies discussions but it may help students to see that some of the regions can be defined by criss-crossing the country with relatively simple boundaries – 1 major east-west line, 4 major north-south lines, and 3 minor east-west lines. While there are many defintions of regions in the United States, the one I propose here is perhaps optimized for being able to remember and visualize the regions.
What if we were to draw a map of a suggested partition of liberals and conservatives into two geographically distinct areas? How would it look like? I know there are many cons to this, including having to relocate people who may be tied to their current areas, but there are also pros, like getting rid of the gridlock and allowing people the freedom to try the things they want to try (something that we take for granted in science, being partially empirical and testing things empirically, not just arguing philosophically).
Also, people might feel better being surrounded by people who share their values and it would create less conflict. We may be able to mitigate conflict across the suggested geographical boundaries by having good trade agreements….
If you’re talking about people moving to states that reflect their politics, that’s already happening. It’s probably bad for the country, because it sends people to Congress who don’t have to worry about being too extreme to get elected, though they do have to worry about being moderate enough to be primaried. https://www.npr.org/2022/02/18/1081295373/the-big-sort-americans-move-to-areas-political-alignment.
Might have to go lower than state level for people to really be able to try out their ideas. Still too much opposition, even at state level because there are both right and left elements in different parts of the state. And there are things that the fed gov meddles in that also make it hard to try out ideas, like abortion and schools and guns. Also things that the global economy makes hard to try (not due to laws, but due to the temptation to have stronger economic ties to it instead of one’s community, which leads to Molochian dynamics)
Also, this segregation idea bothers liberals as much as trans ideology bothers conservatives. First because phenotypic liberals don’t like strong boundaries (that is a phenotypically conservative trait). Second because it reminds them of segregation based on race in the south, which was just a way to enforce a caste system. This is not about caste.
I told you why I thought it was bad. And this has been pointed out and fretted about by many in the center 2/3 of the spectrum, from left to right. It has nothing to do with echoes of racial segregation. It’s about the stability and governability of the country.
Also, your definition of extreme is relative to your liberal politics.
Extreme relative to a center of gravity where political compromise is possible.
Or maybe relative to a mean of a distribution which keeps getting lower in the middle and higher at the extremes. People are less and less happy with the status quo and tend to go to the extremes of the liberal/conservative continuum. I think we need to ultimately transcend this (continuous) trait to move forward, recognizing that there are benefits to both sides under different circumstances, as is the case with all evolved traits. We must move beyond demonizing the other side, beyond agreeing to disagree, into a synthesis of opposing views and an implementation of them. The question that becomes relevant, is at what level of human organization should this synthesis be implemented? Hence the map question.