Graph of Mass Shootings
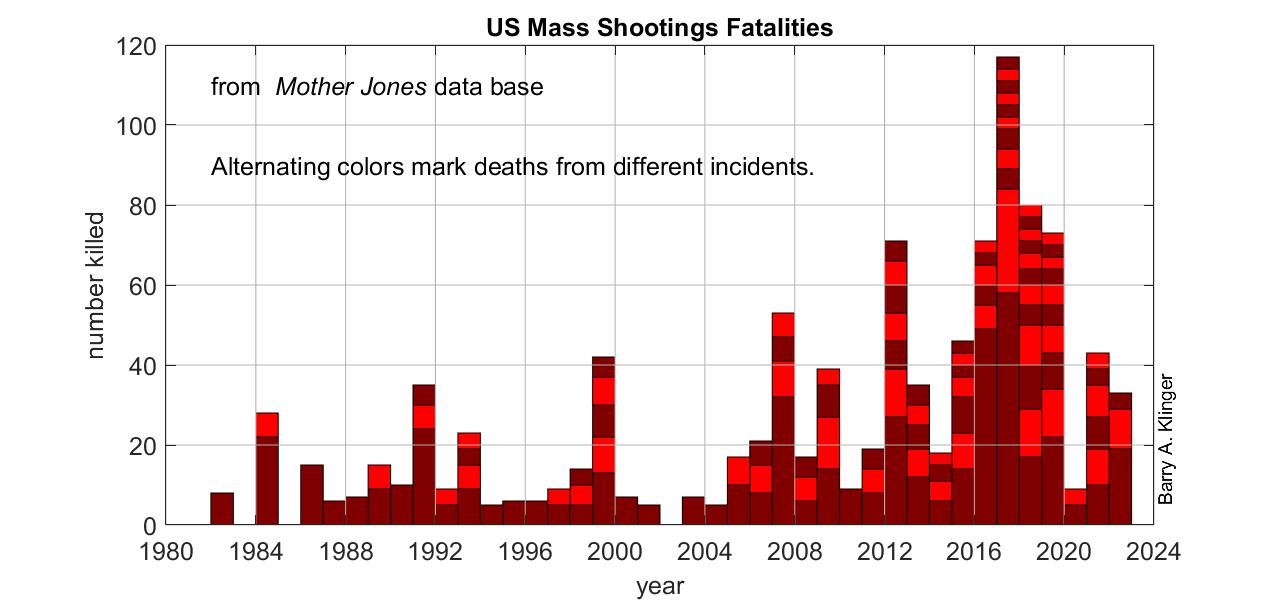
I have updated my graph showing number of mass shootings and number of casualties from mass shootings for each year. The incidents include public attacks in which at least 4 people were killed and exclude shootings stemming from “robbery, gang violence or domestic abuse in private homes.” The data is from the Mother Jones database compiled by Mark Follman, Gavin Aronsen, and Deanna Pan.
The data shows growing numbers of mass shooting deaths and incidents into the late 2010s. The year 2020 had a very low count of both, presumably because fewer people were out and about. Still, 2021 was also lower than any of the four years before 2020. The current year has already nearly reached the same number as 2021 even though the year is less than half over.
The year 2022 so far has been dominated by the racist attack against African Americans in Buffalo and the attack on elementary school children in Texas. Some of the most deadly attacks in recent years include the Las Vegas country music concert in 2017, the Pulse nightclub in Orlando in 2016, and the elementary school in Connecticut in 2012. Those 3 attacks account for 134 out of the 539 deaths in 2011-2020.
The Mother Jones database also shows that in some cases there were many more injuries (not plotted in graph) than deaths: 27 in Dayton Ohio (2019), 546 in the Las Vegas attack, and 70 in the Aurora theater (2012).
The two big 2022 mass shootings occurring so close together in time is a disconcerting. It remains to be seen if we have returned to the upward trend in gun massacre deaths that was interrupted in 2020.
It is worth noting that deaths from mass shootings are a small fraction of murders. In the US, the murder rate in recent years has been around 50 per million, or over 15,000/year for the entire population, though this number has been increasing in the last few years. This is not to minimize the horror of dramatic mass killings or to imply that they are not a serious problem that society needs to address.