An American Resource: Income of the Rich
1. What is the Limit to Taxing the Rich?
There has been a lot of talk lately of the government spending huge amounts of money on new programs. There is also talk that perhaps some of that spending should be paid for by taxes. Finally, there is a widespread opinion that any new taxes should fall mostly, or entirely, on the rich.
How much money do the rich have to tax?
How Much Money Are We Talking Here?
Let’s get some numbers for reference. If you’re in a hurry, the following paragraph is summarized in the table below. Later I’m going to use data from 2017, so let’s stick to that year.
The United States had a population of about 325 million people. That year, the per capita Gross Domestic Product (GDP) was $60,060. Therefore, the GDP was $19.5 trillion, a number which is probably impossible for a human being to visualize, but which we can compare to other gargantuan numbers. The federal government spent about $4.0 T and collected (mostly in taxes) $3.3 T (Congressional Budget Office Historical Data), which comes to 20% of GDP in spending, 17% in taxation, and 3% in borrowing. State and local tax revenue (compiled by US Census) was another $1.4 T, or 7% of GDP.
| Size of United States Economy and Government Spending | |||
| Description | Total ($ T) | Per Capita ($ 1000s) | % of GDP |
| GDP | 19.52 | 60.06 | 100.0 |
| Federal Spending | 3.98 | 12.25 | 20.4 |
| Federal Revenue | 3.32 | 10.22 | 17.0 |
| Federal Deficit | 0.66 | 2.03 | 3.4 |
| State & Local Revenue | 1.42 | 4.37 | 7.3 |
President Biden’s “American Jobs Plan” to improve US infrastructure proposed to spend $2 T over eight years. That’s a lot of money, but the annual cost is $.25 T, which is 6.3% of the federal budget and less than 1.3% of GDP.
Population growth (around .6% a year), inflation (1-2% a year), and real per capita income growth (1-2% a year) combine to make GDP, federal spending, and all other collective spending numbers grow by 3-4% a year. So projecting 2017 figures to say 2022, GDP etc. should all be 15 to 20% higher.
2. Portrait of Household Income
The Income Distribution
The answer to my question can be found in The Distribution of Household Income, 2017, published by the Congressional Budget Office (CBO) in October 2020. For technical details about the report, see Appendix at the end of this document.
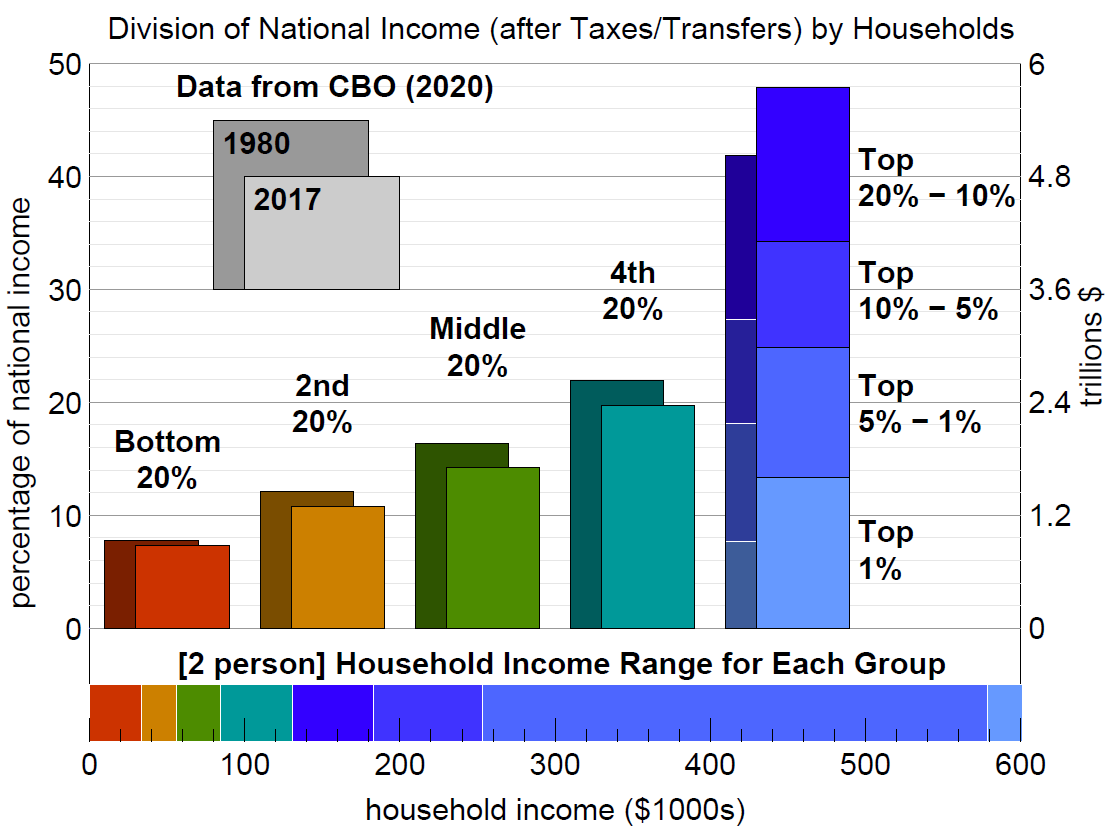
The households are ordered by income, so that the lowest-income fifth of the population is in one group (called a quintile), next lowest fifth is another quintile, etc. The top quintile is subdivided further to get statistics on the top 1%, the top 5%, and the top 10%. The bar graphs in the figure show the percentage of total national income that went to each group of households in 1980 and 2017.

In 2017, the top quintile received nearly half of the total national income. The top 5% alone received 25% of the total income, more than the total earnings of any of the bottom 4 quintiles. The richest 1% got almost 14% of the national income, with at least 20 times higher average household income than any of the bottom 3 quintiles.
The wealthy always got a large share of the economy, but that share has grown since 1980. The three middle quintiles each lost more than 1% of the national income. Note that for a group earning about 10% of the national income – such as the second quintile – losing 1% of the national income means a loss of about 10% of the group’s income. Even the households in the 80% to 95% range lost a little ground over this period. The 95%-99% group gained about 1% of national income. The top 1% gained another 6%, almost doubling its share from 1980.
Many people consider this change to be a gigantic transfer of wealth from working class and middle class families to the rich.
Inside the Quintiles
How much money does it take to get into a specific income group? The bottom of the figure shows the income limits for each group (for 2017). For a household of two people, an income in the low ten thousands puts you in the bottom quintile, mid ten thousands in the 2nd or 3rd, and around $100,000 puts you in the 4th. A household needs $250,000 to get into the top 5%, and almost $600,000 to join the 1% club.
3. So How Much?
Marginal Tax Rate Barrier
As marginal tax rates become high, they grow less effective at capturing income. Rich people make a greater effort to hide money from the tax collector. Even aside from that, we can’t have a tax rate of over 100%, and we can’t have a marginal rate greater than 100%. If we are trying to only add taxes to some upper income range, we hit a Marginal Tax Rate Barrier before we hit a tax barrier. I explain this barrier in a previous post. If the minimum after-tax income of any households in the group is AL, and the average household income of the group is A, then the additional revenue can be no more than A – AL. Because of legal and illegal methods of tax avoidance, the actual revenue collectected will be well short of this amount as well.
Income Which Can Be Taxed More
The sum total 2017 income for the country after taxes and transfers was $12 T. This is strangely lower than GDP, a curiosity I discuss more in the Appendix. In any case, I’ve labelled each 10% tick mark on the vertical scale of the bar graph with $1.2 T. From this you can aggregate income for the top 1%, 5%, and 20% and calculate the average household income (see table below, items 3 and 2). The horizontal bar at the bottom of the figure shows the minimum income of each group (table, item 1), which allows for calculation of the income below the Marginal Tax Rate Barrier (table, item 4).
| Measures of Household Income for Top-Earning Groups | |||
| quantity | top 1% | top 5% | top 20% |
| 1. minimum ($1000’s) | 580 | 250 | 130 |
| 2. average ($1000’s) | 1250 | 470 | 230 |
| 3. aggregate ($ T’s) | 1.6 | 3.0 | 5.8 |
| 4. available ($ T’s) | 0.9 | 1.4 | 2.5 |
Scenarios Calling for Higher Taxes
Biden has argued for a 16 year pay-back period for his infrastructure plan, but even if we do pay-as-you-go, $250 billion a year amounts to only 16% of after-tax income from the top 1% and 8% of the top 5%. Considering the huge increase in income that the top 1% has gotten in the past 40 years, 16% higher taxes (or a smaller amount if spread a little further down within the top quintile) is not going to break the bank. However, it is 32% of the Marginal Tax Rate Barrier amount for the top 1%. It would constitute a large increase in the marginal tax rate for that group.
On the other hand, suppose we wanted to close the federal budget deficit as well. That cost, combined with infrastructure, would be about $.9 T, a much taller order. If borne only by the top 1%, it would bring their marginal tax rate to 100%, and would be hard to sustain even for the top 5%. Such a large tax increase would probably have to fall on households throughout the top quintile to be feasible. Households at the 80th percentile of income (around $130k for a family of two) are not wealthy, but a tax could be designed to fall relatively lightly on households below the top 5%.
How Much Income Do the Rich Have to Tax?
The top 1% would have no trouble paying for a tax increase raising less than $100 B. Increases in the $100-200 B range would be a substantial change for the top 1% but not large for the top 5%. $1T would be a substantial tax increase even if applied to the entire top quintile. The upper limit of feasible tax increases on the top quintile is probably around $2 T, which would raise marginal tax rates from 37% to 83% on income above $130k.
To answer the original question, upper income brackets have a few trillion dollars of income, but the marginal tax rate barrier limits the size of tax increases targeted to a certain income bracket. In an emergency, the government could collect up to maybe $2 T in taxes, but only if the net is extended fairly widely in the richest 20% of families. Short of an emergency, I doubt it is possible to reach as high as $1 T in new taxes on upper incomes even with a solid pro-tax majority in all 3 “houses” (Representatives, Senate, and White).
I’ve ignored dynamic effects of raising taxes. A burst of infrastructure spending will expand the US economy and generate more revenue? An exodus of angry millionaires moving to Bermuda will generate less revenue? I’m leaving those debates for another day.
Of course none of this is to say if or by how much taxes should be raised. The alternatives of chronically increasing federal deficits, collapsing infrastructure, and worsening climate disasters are all plausibly worse than the harm of reducing the income of families making hundreds of thousands – or millions – of dollars. But if we are going to talk about raising taxes on the rich, we should have a realistic view of what is feasible.
Barry, Very good information and cool chart.
I think it would be cool too if you included another bar chart (just like you did for income), but this time show the TAXED numbers for the different quintiles, with the % of total tax revenue on the left, and total $ on the right. And, show, just like you did with the income chart, show the two 2017 & 1980 numbers in overlapping bars.
I bet, though, that this TAX by quintile information may be harder to get.
I assume all of the 1980 numbers are adjusted for inflation for 2017 dollars. I did not see that you mentioned this detail, but it is safe to assume that is what you did.
Yes, good topic for a future post. In the past, CBO itself has also written about the distribution of taxes. I haven’t looked lately to see if I can make any improvements on how the info is presented.
You’re only looking at income tax here, which is a good starting point.
But a wealth tax has benefits in restraining the unlimited growth of inequity, and could use a similar analysis.
And separately, an inheritance tax.
You’ve established that there’s enough from income tax, but these other wealth-based taxes should be considered as well.
Finally, MMT calls into question the merits of looking at taxes as “paying for” expenditures, rather than as a tool for managing the supply of money (and in whose hands it accumulates).
From this standpoint, the issue is not really how much money do the wealthy have, but rather, how much resources can the government command from the economy for these purposes.
I agree, these are all good topics. Actually if you or someone else wants to do a guest post on this stuff, I’d be happy to put it up. Or to be precise, I’d be happy to put it up as long as I like it. That could include posts expressing opinions I disagree with but would not include posts with obvious errors of fact.