COVID Deaths State to State
How hard has COVID hit different states? Though many dashboards show voluminous COVID statistics, I have not seen a clean comparison. Data on 50 states is just too much to take in at once, so I continue to use state groups to visualize how different states have fared. Deaths include confirmed and probable COVID19 deaths from The Atlantic magazine’s Covid Tracking Project for the contiguous United States.

As left panel shows, the highest death rates for the year (so far) occurred in the Northeast and in Louisiana. Surprisingly, the very highest by a long margin is NJ, not NY, and southern New England actually did slightly worse than NY. These all had about 40 deaths per million people for the 32 weeks of the record. If the entire US had that rate for a year, that would be almost 700 thousand deaths.
These numbers were considerably worse than other states, which ranged from 25-30 deaths/million (FL and GA) to 20 deaths/million (TX and PA) to 15 deaths/million (CA), 10 deaths/million (WA, Great Plains states) down to 5 deaths/million (OR, northern New England).
To better understand how different states responded to the pandemic, I’ve looked separately at the period since the first quarter-year (13 weeks) of the onslaught (right panel of figure). As I discuss in my post What’s Unique About US COVID Deaths, the first peak of deaths hit before countries had seen much of what the disease actually did (though experts saw the impending consequences ahead of time), but places struck later had a lot of warning.
Death rates are very different for this period: NY had the very lowest, less than 5 per million, and NJ and PA (10/million) and southern New England (15/million) were in the bottom half. The worst-hit was FL (almost 40/million), followed by LA, TX, and GA, then the rest of the South as well as Southwest and southern Mountain states.
While much has been made of the divide between the response of Democratic-led and Republican-led states, the most striking feature of this ordering is latitude: states that were warmer (except for the DC group) did the worst. Conservative Plains states did about as poorly as liberal California.
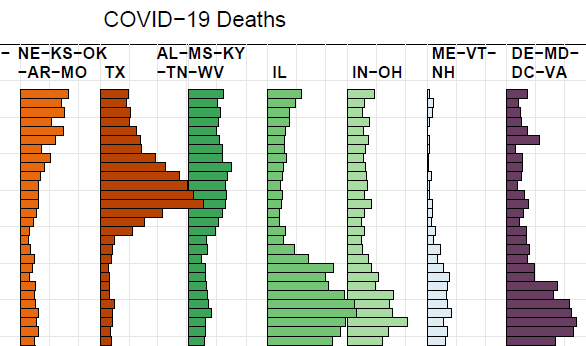
COVID’s Path Through the States
Dividing the year into two periods is somewhat crude, so let’s look at how deaths changed from week to week. To make easier to read, states with the highest peaks were put in a separate panel, and in each panel state data was placed left-to-right in roughly west-to-east order.

The top panel shows that all the hardest-hit states had a large peak in the beginning of the pandemic, after which deaths decreased over about 6 weeks as governments and residents reacted to the danger. In almost all of those states, once death rates came down, they stayed low (generally under 20 deaths/million).
Some other state groups (bottom panel), such as DE-MD-DC-VA, IL, and IN-OH, also had peaks in the first wave, but with much lower numbers than the worst-hit. The high warm-state death rates that the first figure showed can be seen as peaks in July-August in TX, FL, GA, NC-SC, the Southwest, and (to some extent) CA and AL-MS-KY-TN-WV. LA got the worst of both worlds, with a large summer peak following its large spring peak.
Plains and northern Mountain states (NE-KS-OK-AR-MO , ID-WY-MT-SD-ND) had some increase in summer but an acceleration in fall. Meanwhile, in TX and Southeast states that had summer peaks, numbers largely stayed above 20/million deaths per week.
There was a lot of speculation that COVID would “go away” during the summer, in analogy to the flu. Instead, the opposite happened, with much of the country enduring a summer peak. The fact that hotter states had a summer peak and colder ones seem to be having a fall increase suggests the following guess: people in hot states spend more time indoors in the summer to escape the heat and people in cold states spend more time indoors in the winter to escape the cold. In places like MT and perhaps even KS and NE, it starts getting cold as early as October. Thus states that did not embrace countermeasures such as social distancing had outbreaks as people gathered more indoors.
It is probably impossible to confirm this guess given the many social and physical variables that vary among states. We should also remember that deaths tend to lag infections by 1-3 weeks.
The Whole Nation
Death rates climbing at different times in different states led to a result that the United States as a whole had an early peak of 14,000 deaths per week and a summer peak of 8,000 deaths per week, and never went below 3,000 deaths per week. The figure below shows the sums. Remember, a weekly death rate of 3,000 is equivalent to about 150,000 dying in a year. Based on rising caseloads, we are probably on the verge of a third peak in deaths as well.

The first peak represents a failure to anticipate the harm from the virus. This failure was shared by many rich nations in North America and Europe. The second peak represents a uniquely American (US) failure to learn from the first wave.
Three of the 4 differently-colored regions in the figure above all have similar population sizes, and the western states have about half the population so the deaths there should be double in order to compare with the other regions. Other than in the Northeast, the country, including Democratic-leaning west coast states, did not do a great job of suppressing the virus, and even the Northeast could have done better.
As both Europe and America see rising cases, Germany and other countries are taking aggressive measures to stop another peak in deaths. Will the United States learn from our failure to stop a summer peak or will we repeat our mistakes as a fall wave of deaths crashes over us?
11/2/2020 Addition
Adding the week ending on 1 November, the national number of deaths has not risen appreciably from the previous week despite rising numbers of cases. Individual states continue to have very different trajectories.
In the northern Mountain region, ID-WY-MT-ND-SD deaths increased by over 30% to 59/million, by far the worst of any state group. The Southwest/Mountain group, NV-UT-CO-NM-AZ increased even more, over 40%, but to a much lower level, 14/million. ME-VT-NH almost doubled in deaths, but was still the lowest of any group at 3.4/million. Other groups, including MN-WI-IA, OR, TX, and WA had increases of greater than 10% but less than 30%.
Some states did better. DE-MD-DC-VA, FL, CA, MI, and PA all had greater than 10% decreases in deaths. The remaining 10 state groups ranged from 10% decrease to 10% increase.