COVID Toll Across America
I have seen graphs of COVID-19 casualties in individual states and in the country as a whole. Here I display death statistics in a new way that more clearly summarizes the pandemic impact across the country.
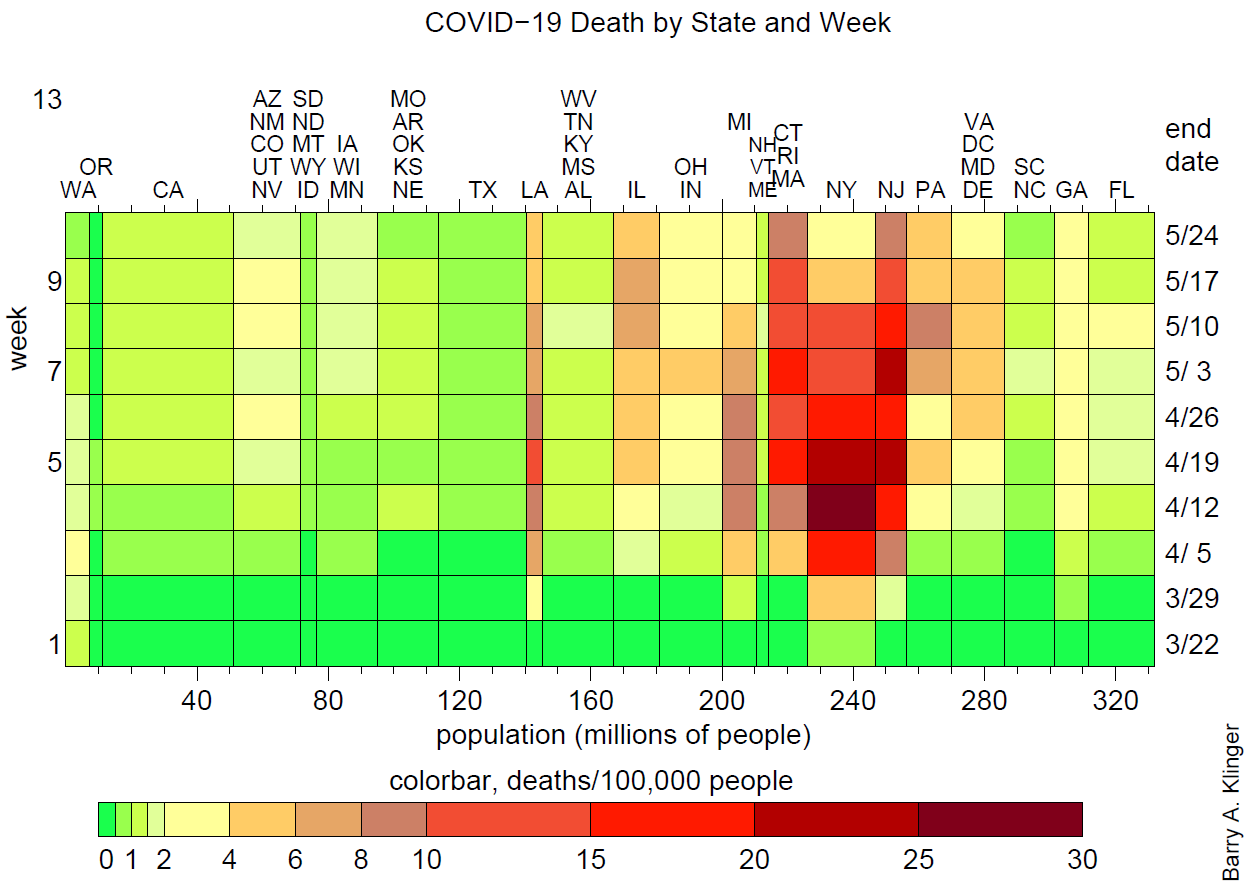
In order to reduce reduce complexity, I combine neighboring low-population states with similar death rates into groups. This allows us to see statistics for the lower 48 states (+ DC) in terms of only 22 groups.

For each group I tabulated total deaths for each of ten weeks since the week ending on Sunday 22 March (Heptal week Spring 1). I chart the deaths per population in a grid in which each row is a week and each column is a group of states, and the color of each cell tells the death rate. The width of each column represents the total population for that column’s group of states. The states are listed at the top of the column.

From this chart, we can easily see
- High death rate (up to > 20/week for every 100,000 people) in New York, New Jersey, and southern New England.
- Moderately high death rates (almost 10/week for every 100,000) in Louisiana, Illinois, the industrial midwest, and from Pennsylvania south to Virginia.
- Low values everywhere else (around 2/week per 100,000) with slightly higher values in the desert Southwest, Georgia, and Florida.
- A very early peak (around week 4) in NY, with other moderate-to-high rate states having peak deaths around weeks 5-8.
- States with the lowest rates have relatively late peaks, but week 10 is below the peak for almost all 22 of the state groups.
The higher death rates are concentrated in a few states, but these are states with a total of about 80 million inhabitants (highest death rates) and over 70 million (moderate death rates), collectively comprising about half of the United States’ population.
Since death statistics are a lagging indicator, showing us the final state of people who might have been infected weeks earlier, other measures might be better for helping to see where the pandemic is going now. I started with death rates because hospitalization rates (telling us the number of seriously ill people) are not reported for all states, and infection rates are very skewed by inconsistent and changing rules for who gets tested. The death statistic itself is imperfect – the rise in deaths per week compared to the same time in previous years is about twice as big as the number of fatalities listed for the corona virus.
Death data is from The COVID Tracking Project (https://covidtracking.com/data) created by The Atlantic magazine. State populations are from the 2010 census, multiplied by a factor of 1.07 to represent the estimated growth in total US population from 2010 to 2020.
Why the impact of the disease has been so different in different places has generated many hypotheses, none of which give a very satisfying explanation of the data. Some factors include population density, connectivity to other places that were hit earlier, demographics, virulence of the local strain of the virus, dependence on public transportation, and climate.